
Who rules social media? Industry benchmarks for 2022
Written by Ronnie Gomez
Published on March 30, 2022
•Reading time 6 minutes

Sharing your performance data without including industry-specific social media benchmarks is like putting on a play without setting the stage. Sure, people will get what you’re saying, but they’ll probably come to their own conclusions about the bigger picture.
When you look at social media benchmarks by industry, you can find insights that tell a richer story about your strategy, its challenges and its successes. To help, we pulled social metrics to show marketers how different industries performed across all social platforms last year.
Use Sprout’s 2022 Year in Social report to illuminate opportunities and fine-tune your strategy in a way that resonates with your target audience. Before you dive into the data, keep reading to learn more about the metrics, why they matter and how you can use them to make sure 2022 is your best year yet.
What to measure in 2022: Social media benchmarks by industry
Our Year In Social report focuses on four priority metrics: Impressions, posts published, new followers and engagements. These metrics are network-agnostic, which means you can use them to assess your full social media strategy.
Impressions
To understand impressions, you need to understand reach. These two awareness metrics are often used interchangeably, but a distinct difference makes impressions the one to watch.
Reach measures the total number of people who see your content. Impressions measure the number of times your content is displayed in total, meaning a single person could have multiple impressions on a post.
This repeat exposure is a brand awareness game-changer. The more often people see your content, the more familiar they become with your brand. That familiarity builds the momentum needed for next-level engagement, such as comments, follows, DMs and even purchases.
Industry spotlight: Computer software
B2B social media strategy has always been a tough nut to crack, but last year computer software brands stepped up their game in a major way. In 2021, the industry’s average number of impressions reached 1.8 million.
It seems the secret is playing to the sector’s strengths. Software purchases are complex, multi-step processes. It makes it hard to use social as a bottom-of-the-funnel sales tool. That’s why successful brands are shifting their focus to awareness.

Brands like Drift use social to provide audiences with free insights from industry experts, supporting their followers as they get closer to their professional development goals. This proactive engagement builds trust with target audiences before they’re in the buyer’s seat.
Posts published
Posts published is a straightforward metric. It measures the number of posts published across accounts during a specific period. While this may seem simple, it’s oftentimes at the foundation of a successful social media strategy.
Narrowing in on posts published can help you reverse engineer the publishing volume needed to reach certain impressions, engagements and engagement rates. If your social media goals are data-informed, then figuring out how to reach them is just a matter of reviewing your previous performance reports.
This isn’t to say you should sacrifice quality in favor of quantity. It’s more a matter of prioritization. If you’re a one-person social media team, then focus your energy on the networks that make the biggest impact on your overall marketing strategy.
Industry spotlight: Professional sports
When it comes to publishing volume, sports franchises are knocking it out of the park. Last year, professional sports teams published 3.1K posts on average. To put that number in perspective, it’s more than double the social media benchmark across all industries.
To be fair, this industry has an edge over the rest. Footage from a single game can be repurposed into a ton of posts. For example, the Atlanta Hawks got over 10 Instagram posts out of their game against the Portland Trailblazers.
Even if you’re not a major sports team, you can still replicate this strategy. Next time your business has something fun or interesting on the calendar, look at the event through a social-first lens to get more mileage out of your presence.
New followers
Somewhere along the line, follower count got mistakenly labeled as a vanity metric. In reality, that couldn’t be further from the truth.

According to the 2021 Sprout Social Index™, nine out of 10 consumers will buy from brands they follow on social and 86% will choose that brand over a competitor. As social shopping continues to grow in popularity, getting your follower count up has the power to contribute directly to revenue.
Industry spotlight: Retail
Retail brands stand a cut above the rest when it comes to courting new audiences. On average, the industry attracted a whopping 4.8K new followers in 2021.
The social landscape changed dramatically over the past year and multimedia content has never been more important for audience expansion. This presents both a challenge and an opportunity for social marketers. Videos can be repurposed in a lot of different ways, but they tend to be more time-consuming to create and edit.
@cocokindskincare #duet with @bondenavant if you try this, let us know!!! #cocokind
The key is to not overthink it. Follow Cocokind’s lead and lean into informal, product-driven video content that inspires fans with new product uses.
Total Engagements
Total engagements measures the number of times users engaged with your posts during a specific reporting period. This is a cross-network metric. It covers all engagements including likes, reactions, retweets and other network-specific interactions as well.
Social media engagement benchmarks matter because they help you identify the content that resonates most with your audience. As you pinpoint the factors that compel people to interact with your content, you can repeat those successes down the line.
This all contributes to a more audience-centric understanding of what makes a great social post. Having this data at the ready can help you become more intentional about your strategy at the individual post level. It can also help you politely refute any pesky “just post this” requests.
Industry Spotlight: Higher education
Last year, the higher education industry saw 190.9K average total engagements. That’s over 70k more than the standard across all industries.
Higher education institutions have a difficult content mix to manage. Finding an even spread of content related to the institution, alumni, athletics and specific colleges is almost impossible. That’s why many have opted for a segmented approach.

When you search “Purdue” on Twitter, you’ll see they’ve created a number of handles for specific audience interests. This relieves the pressure of being everything for everyone, so they can speak directly to specific audiences.
The benefits of social media engagement benchmarks
Benchmarks can turn last year’s data into this year’s advantage. Leveraging social data is the most meaningful way you can tailor your strategy to your audience’s needs and business goals. Now that you have some new insights at your fingertips, here are three ways you can use social media engagement benchmarks to level up your strategy:
1. Industry benchmarks serve as inspiration
Every industry has its own unique approach to social media. If you want to revamp your social media strategy, looking beyond your competitors can be the first step to your next game-changing campaign.
Use industry benchmarks to find out which brands are outpacing the rest when it comes to the metrics listed above. As you look through their social presences, try to identify what they’re doing differently and how your brand can emulate them. This is a great way to come up with innovative ideas that bring something new to your target audience.
2. Competitive benchmarks give your performance context
Understanding how your brand stacks up against competitors can help you tell a richer story with your performance data. With competitive benchmarking, you can better translate your efforts to business stakeholders who may not know what social media success looks like.
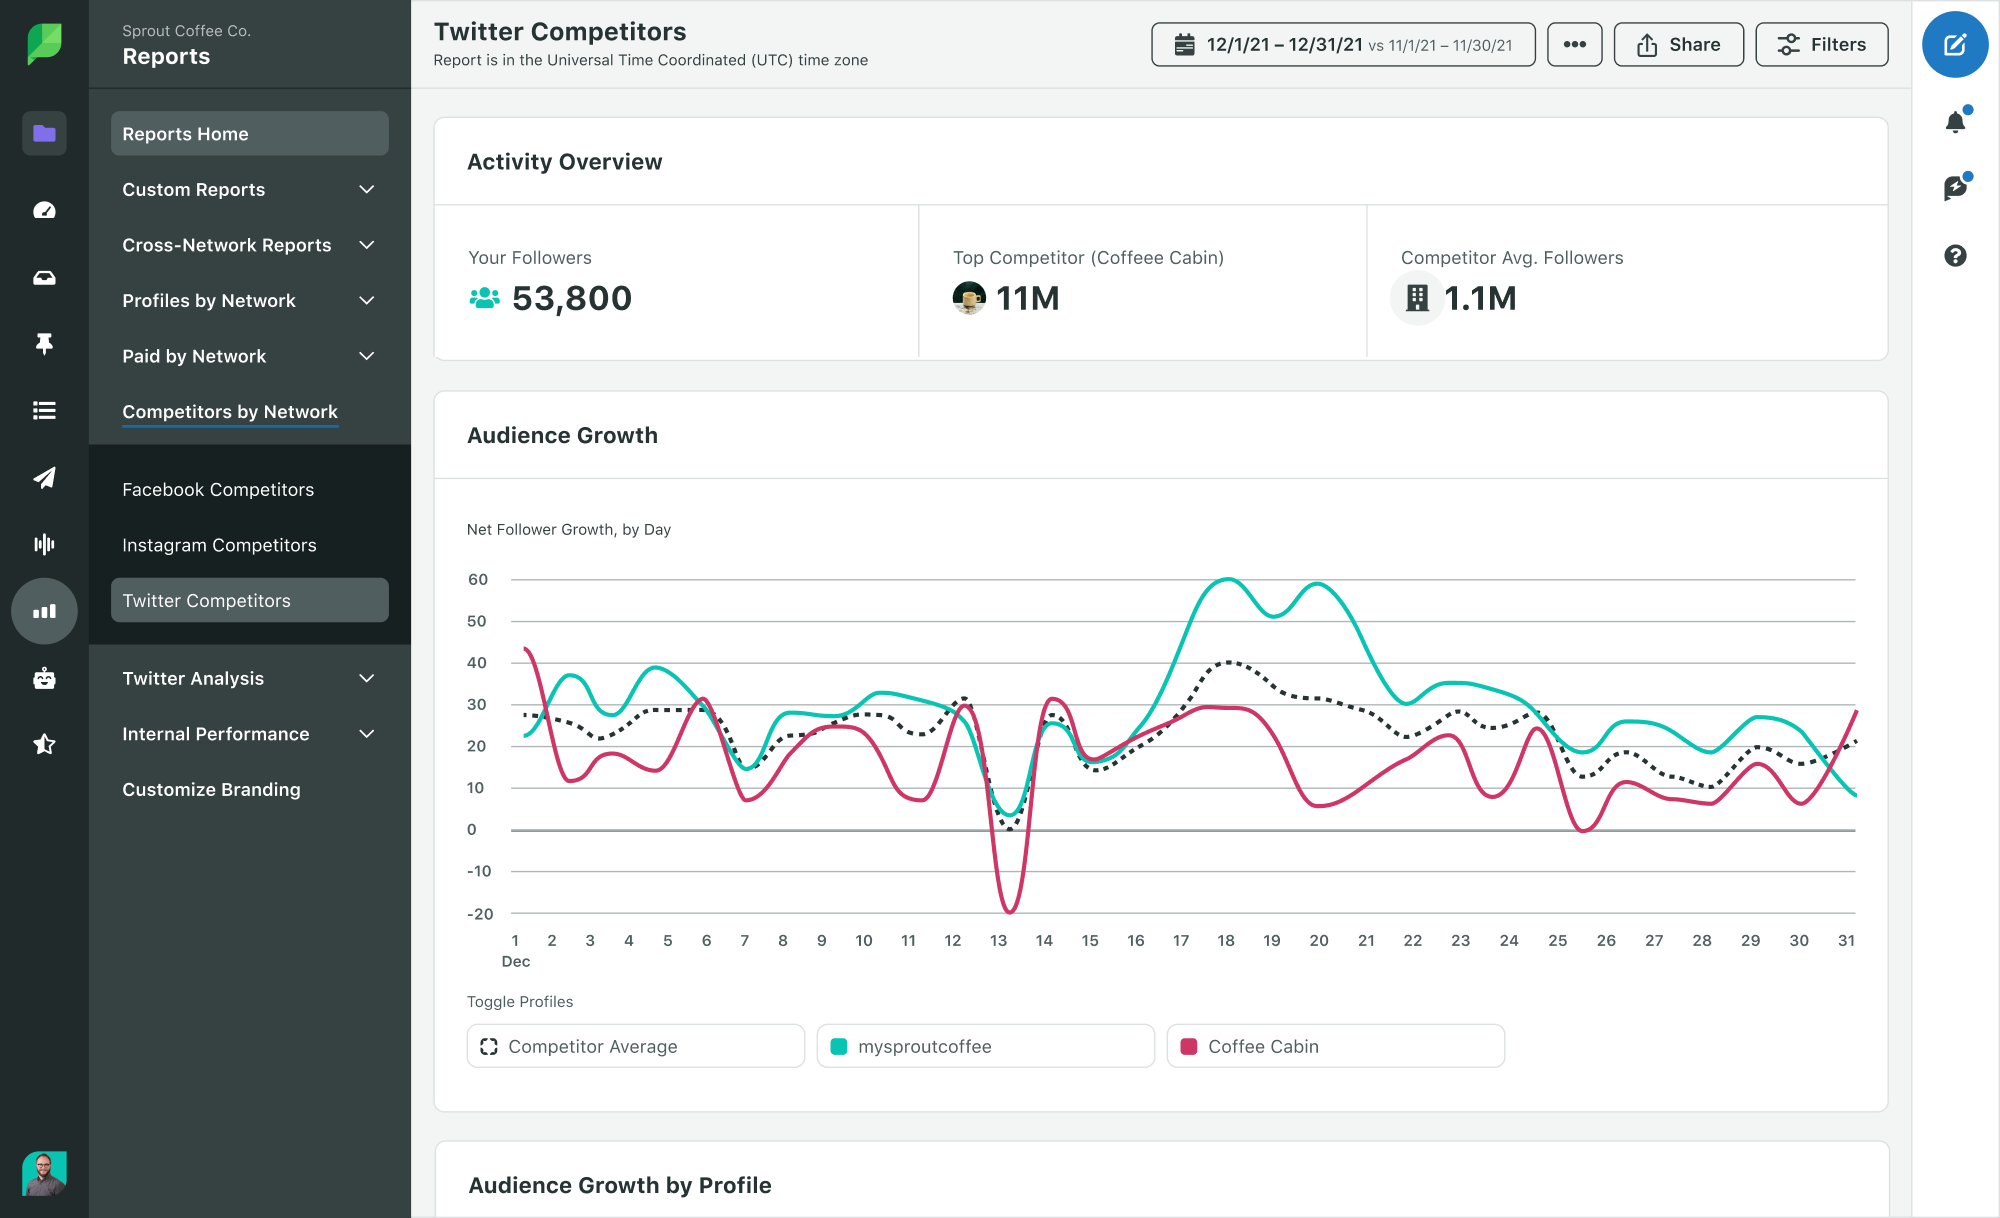
With Sprout, you can use network-specific competitor reports to compare your performance with your top business rivals. These reports offer insights on publishing behavior, fan growth and engagement so you can benchmark the metrics that matter.
3. Personal benchmarks inform your immediate goals
Your personal social media engagement benchmarks should be your go-to resource for creating actionable goals. While industry social media benchmarks can give your performance color, your brand’s own year-over-year benchmarks tell the story of your growth over time.
This is especially meaningful for brands that pilot new social strategies or adopt a new network presence. It’s not fair to compare a strategy in its early stages to one that’s had a chance to mature and yield results.
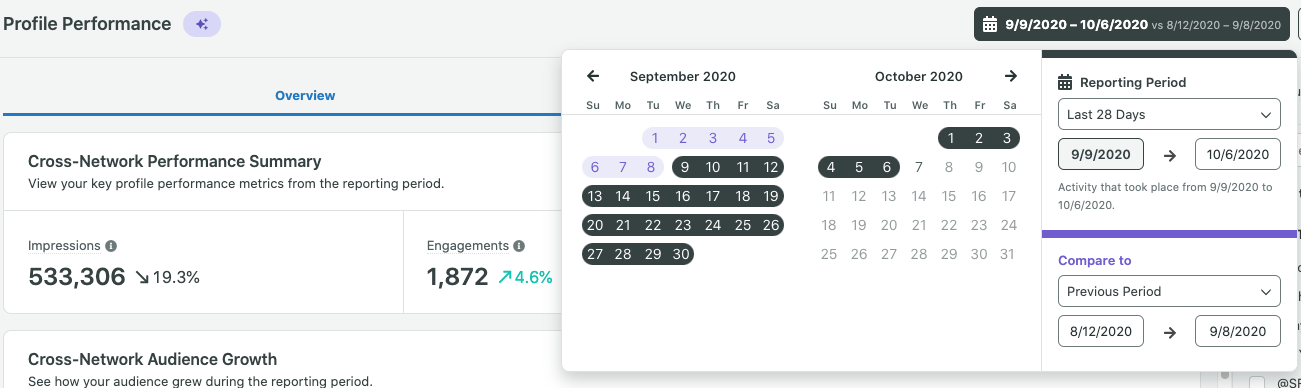
Comparing your month-over-month or year-over-year performance can provide meaningful insights on how you’re pacing toward your growth goals.
Year in Social: Sprout’s 2022 social media industry benchmark report
Now that you know where to start with industry, competitive and personal benchmarks, you have everything you need to optimize your strategy for maximum success.
Use Sprout’s Year in Social report to see how your brand stacks up against your industry and social at large. Check it out here and unlock more social media success in 2022.
Recommended for you
View all Recommended for you- Categories
In bull or bear markets, social media intelligence makes all the difference
Published on July 6, 2022 Reading time 6 minutes - Categories
Sprout on Sprout: 3 use cases for Tagging
Published on May 5, 2022 Reading time 5 minutes - Categories
How to measure the value of social media
Published on March 16, 2022 Reading time 7 minutes